
Kid didn’t finish MAP-R?
![[Post New]](/jforum/templates/default/images/icon_minipost_new.gif)
Anonymous
My kid is new to middle school too. They and a number of their friends didn't finish the MAP-M test. They had MAP testing Tuesday/Wednesday of this week and haven't heard anything about when they'll get the chance to finish. This is pretty normal. I know they had to wait a few days after starting MAP tests in elementary school to get a chance to go back to it. I know my kid's school has homeroom a few times a week, which is where it seems they normally take reassessments and things. I figure that's when they'll pick it up back next week. I have also heard of students having to finish during lunch. My kid had to do that once or twice in elementary school when he still wasn't done with his MAP-M after a second period, but he would score really high so his questions tended to be a bit harder to work out and take longer to do as a result. |
Anonymous
4 points is an average drop. doesn't mean that everybody remain in the same spot. also, these percentiles come from a different population using a different test. you can end up with the appearance of children dropping on the percentile scale where there is not drop in actuality. some will have spring test to refer to but some won't (because they came from a different district). |
Anonymous
You are correct that the MCPS responses to the MPIA request applied only to that year's FARMS groupings and locally normed 85th percentiles. One can make some general assumptions about a school's likely FARMS rate grouping and that the percentiles were similar, but MCPS, without providing specifics, acknowledges that each year there are changes both to the FARMS groupings and the locally normed 85th percentiles based on the FARMS data/MAP scores seen from that year. |
Anonymous
| Can someone explain if the questions are easier why the scores are dropping? |
Anonymous
Yea it doesn’t make sense for the high achievers. From NWEA’s research it’s the lower achievers who end up lower here because they’re less likely to see items from significantly below grade level…. It does seem odd that folks are complaining that their high flyers are struggling |
Anonymous
High achievers are not getting the most difficult (advanced) questions which are worth the most points. Therefore, the highest scores are getting lower. But they are still using the old tables, resulting in misleading percentiles. |
Anonymous
| I always thought my 3rd grader is a great reader, probably not because she scores 202 today on MAP R. She can't make it to the lottery with that score. |
Anonymous
What score does qualify? In any case I think it’s winter MAP, not fall, that counts…. |
Anonymous
Thank you, PPs, for bumping my question. These high achievers don’t sound like they had a solid understanding of some earlier math concepts. |
Anonymous
She sounds like a great reader but the test is about comprehension. That score looks like it would be above local normed 85 percentile, but I’m not in front of that percentile converter. A nice PP always reposts that link and I saw it on one of these recent threads. |
Anonymous
I don’t think you understand what the PP wrote. |
Anonymous
The converter is nationa norm, not local norm https://sites.google.com/view/nweapercentilecalculator For local norm you need the FARMS percentile chart |
Anonymous
Applying the concordance table Changes in the rate of growth in math relative to the 2020 norms mean that these norms are less applicable to math scores derived from MAP with EISA and will provide less meaningful context for student achievement and growth. Therefore, we strongly recommend that districts leverage the concordance table to support decision-making that is consistent with historical decisions based on the 2020 norms. The concordance tables should be used until new norms are released in 2025. There are two categories of use cases for applying the concordance table: adjusting practice and adjusting data. Adjusting practice. This category of use cases involves adjusting cut scores, such as those used for program- placement decisions. Given the increases in winter and spring scores, using unadjusted cut scores results in underidentifying students for intervention services and overidentifying students for talented and gifted programs.6 By using the concordance study to adjust these cut scores in math, partners can make decisions about student placement that are more consistent with past decisions, ensuring that students receive the appropriate level of support. Similarly, the cut scores used for determining which students are on track for proficiency, based on NWEA linking studies, should also be adjusted based on the concordance table. Adjusting data. The second use case category involves using the concordance study to adjust individual scores. It is important to note that the concordance table cannot be applied to aggregate data or directly to growth metrics. Instead, it must first be applied to individual scores, which can then be used to recalculate growth metrics at the student, grade, school, or other grouping levels. This ensures those metrics are not upwardly biased and is strongly recommended when normative growth metrics are used for evaluation or decision-making. Additionally, adjusting data is necessary when scores will be used in longitudinal research that spans the transition period |
Anonymous
|
NWEA are terrible communicators, but here's the key point.
They are going to prefer to give harder problems on current grade level standards, instead of problems at next grade level up. (And the same idea on the other direction at the low end) https://connection.nwea.org/s/nwea-news/17-state-expansion-of-the-enhanced-item-selection-algorithm-MCDOB2VK7YABD3LLL5ILP3OZRLCM?language=en_US How does the enhanced item selection algorithm choose items differently compared to previous versions of MAP Growth tests? A: These tests will have three significant changes to the item selection algorithm. (1) Grade level: Currently, the MAP Growth item selection algorithm emphasizes adaptivity and test content. It creates a test closely matched to a student’s ability level, without factoring in information about a student’s grade The enhanced item selection algorithm is designed to prioritize items that are closer to a student’s grade level when selecting items on the test. This new algorithm finds an item that is best matched to the student’s ability, grade, and the test content needed to fulfill the test blueprints waterfall table on item selection (2) Instructional-Area weighting : Currently, the MAP Growth item selection algorithm uses equal weighting for each of the instructional areas on the test. This means that the algorithm tries to select an equal number of items from each instructional area The enhanced item selection algorithm has the ability to adjust the weighting for each of the instructional areas, enabling tests to provide more items in certain instructional areas (3) Additional content factors: The enhanced item selection algorithm allows for additional content factors to be included in item selection process, such as Aspects of Rigor for mathematics 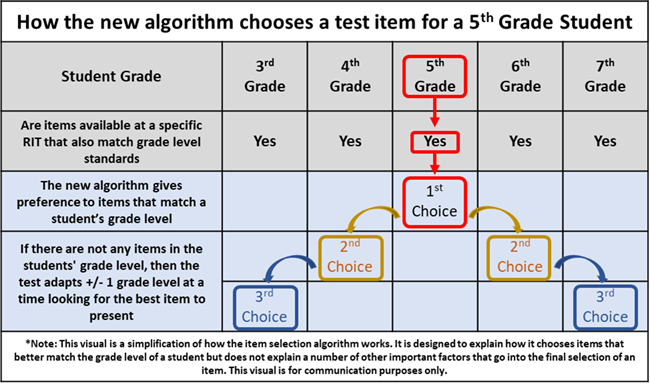
|
Anonymous
|
Here's the concordance table to convert between old and new scores.
PP was right. The off-the-charts 99+%ile scores, from kids who hyper accelerated but didn't learn grade level material thoroughly, get much lower scores on the new test, which poses hard grade-level problems instead of easy higher level "exposure" topics (like complex numbers or radicals) For sub 99%ile, the differences ae minor. https://www.nwea.org/uploads/MAP_Growth_Fall-Winter-Spring_Concordance_NWEA.xlsx |