Schools Doing Best Educating At-risk students - 2019 version
Anonymous
|
[Disclaimer - I do not work for or with the firm that did this analysis. I just find it interesting.]
Empower K12, and education data firm, analyzed the 2019 PARCC scores to see which schools with high percentages of high needs students are performing better than expected for at-risk students. You will not see Wilson feeders, or so-called HRCs on this list, because their at-risk percentages are too low. The 28 schools they recognize as "2019 Bold Performance Schools" educate 10,700 students combined. List of schools: https://empowerk12.org/ Summary of methodology: We analyzed the 2019 Partnership for Assessment of Readiness for College and Careers (PARCC) data and found that at-risk concentration was the most predictive indicator of school-wide PARCC proficiency. Almost 45% of DC students tested in Spring 2019 were considered at-risk. The more at-risk students a school serves, the fewer the number who met expectations on PARCC, our analysis found. Other factors with a statistically significant impact on a school’s proficiency rate after controlling for percent at-risk served include percent special education, English language learners, race, and grade-level configuration. The 2019 model for Bold Performance includes all factors with a statistically significant impact, with at-risk contributing the most weight. |
Anonymous
|
So, the majority of school that are doing well at educating at risk students are 40-60% non-risk students. Dcps needs to work on mimicking what the schools are doing and blending schools.
As a middle class black family I want to know what schools are doing to educate and keep middle class balck students moving forward. |
Anonymous
| Shepherd ES, hands down. |
Anonymous
| Congrats to Truesdell! I hope that's the next school to take off after Barnard and Whittier. |
Anonymous
| Congrats to Payne! That's terrific. |
Anonymous
| ugh Latinx. if you're going to do it, just do "latino/latina." |
Anonymous
Look closely at Shepherd. No other DCPS school has a critical mass of middle class AA families. |
Anonymous
Half of the schools on the list are greater than 60% at-risk. 25% are greater than 70% at-risk. |
Anonymous
Arenn't they like rewarding themselves consulting services, also no real data, downloaded report and pretty meaningless : ( |
Anonymous
This. It’s unethical but it gives their clients a win - and the public doesn’t seem to notice or care. |
Anonymous
We must be looking at different reports. It's a pretty simple analysis - the schools with at-risk students performing above expectations - but the data is there. Probably not important to some, but important and meaningful nonetheless. 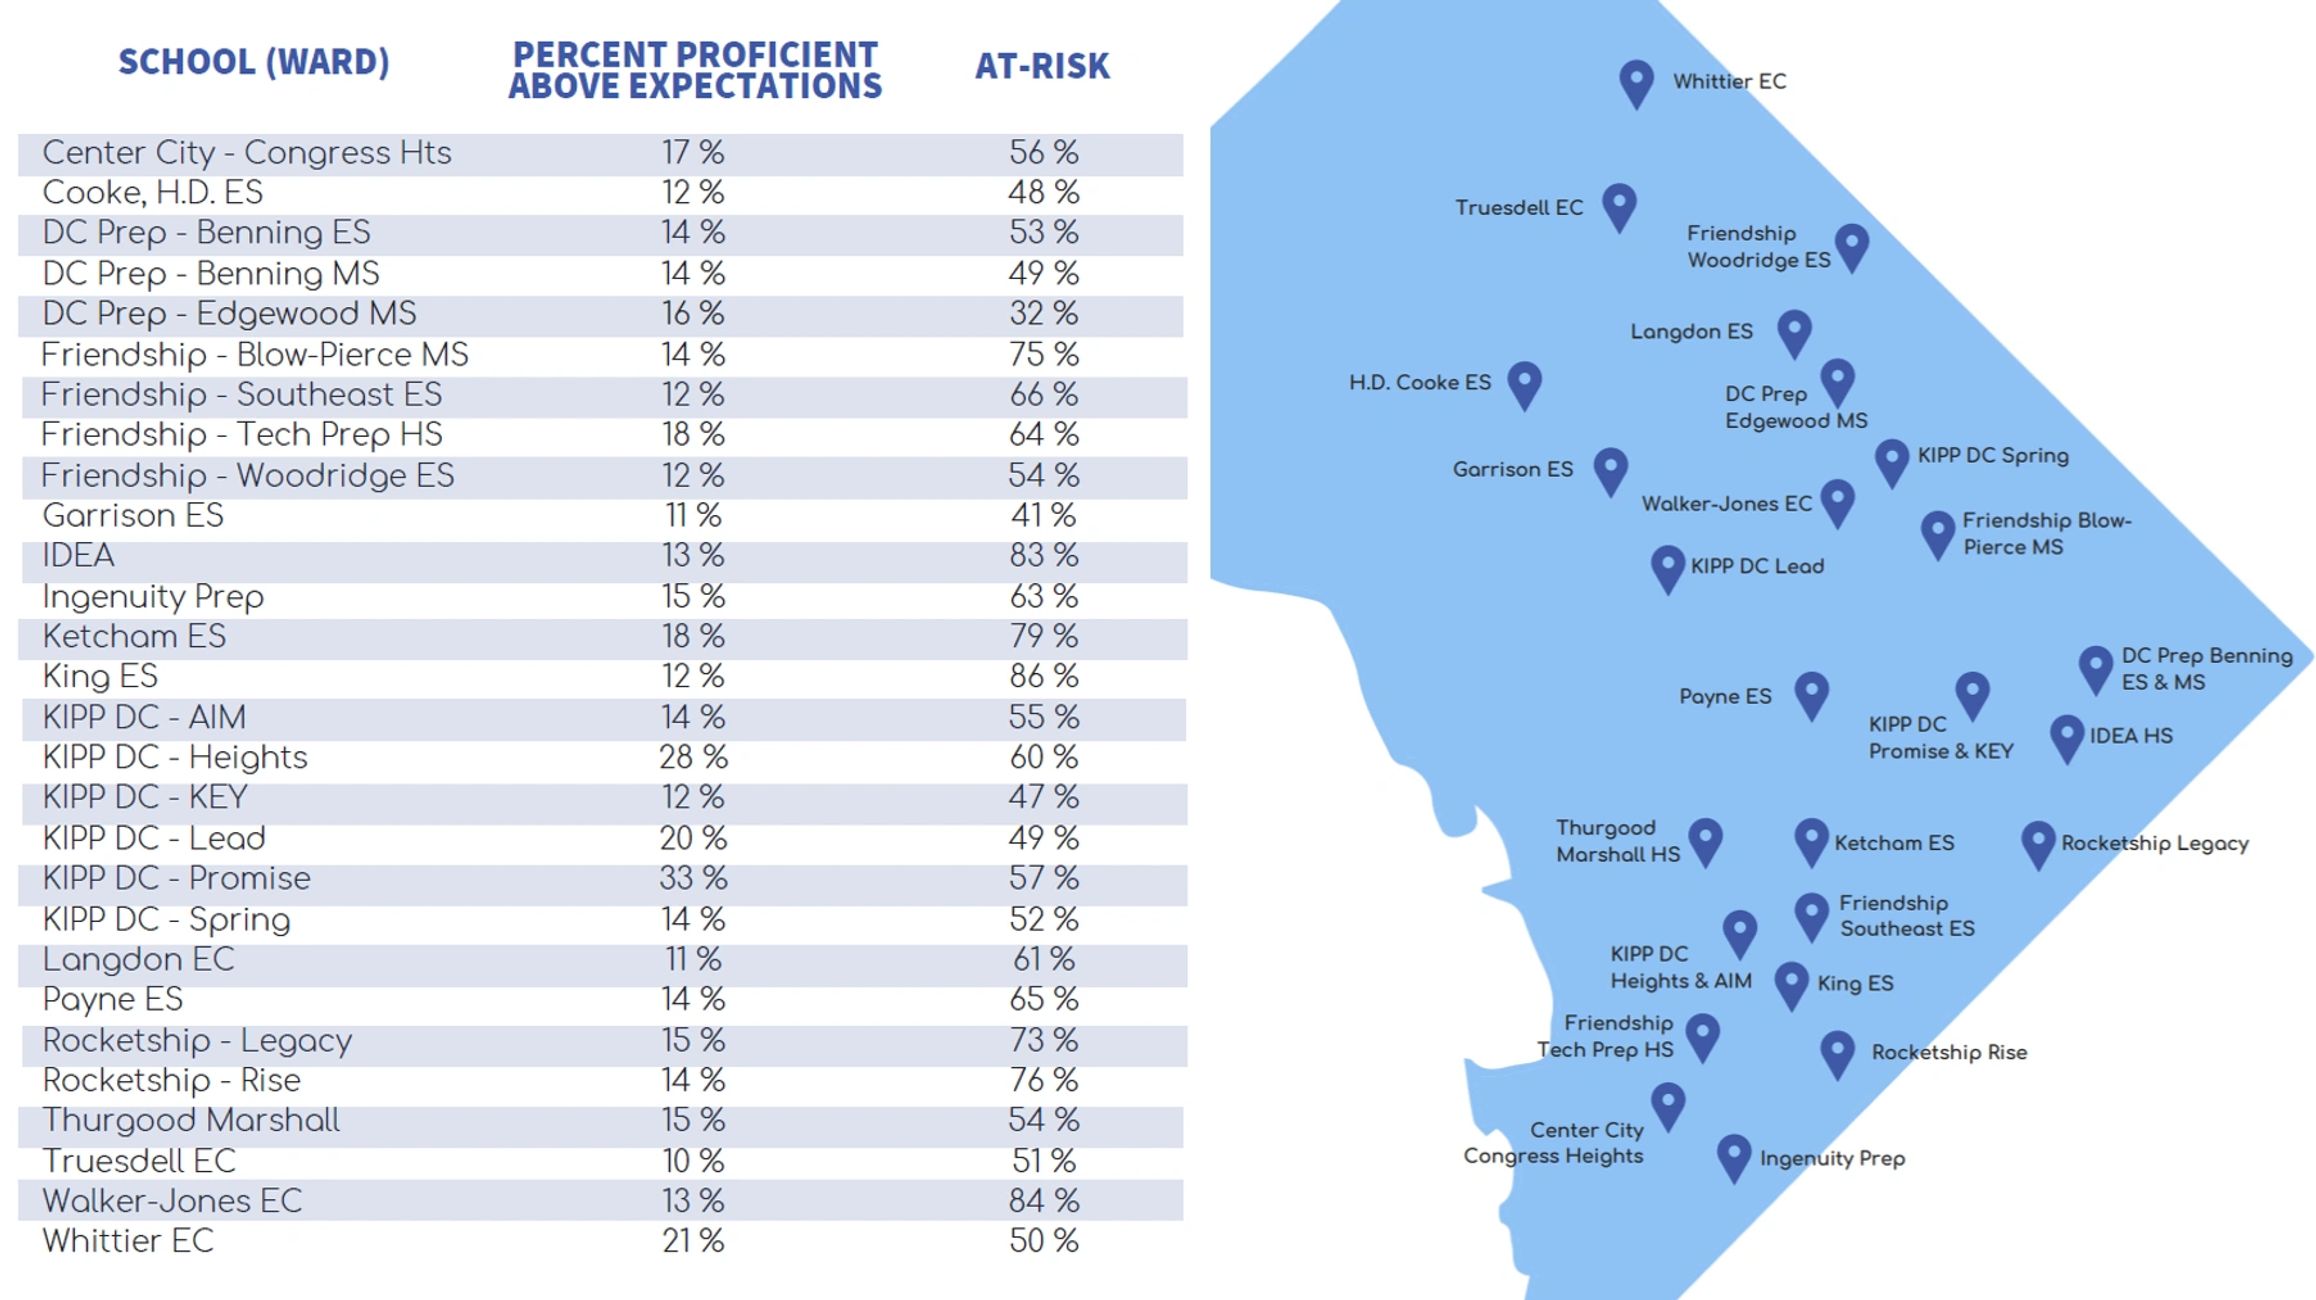
|
Anonymous
Did you actually read the reports per schools to find out what they are doing, no substantive information or data or sharing of best practices. Even checked out some of the tech that some schools said they were using, and very underwhelming indeed. What exactly are we promoting or celebrating here, who is this company? Supporting and selecting their own based on what...? |
Anonymous
|
It may not be earth shattering but there are some things that these schools are doing which should be replicated - and you see it in the narrative reports.
ES and MS teachers in the same feeder pattern meeting frequently about the kids who will be transitioning. Using data to target interventions in a more precise way. SEL programs and parent engagement. These are things that probably happen in your school automatically — not so much in some of these. To me a school that is helping below level and disadvantaged kids improve and move toward proficiency - which doesn’t happen in one year - are probably ‘better’ than a school where everyone comes in ahead of the game. The schools in question appreciate the recognition. They are doing HARD work. I don’t care who crunches the data - it goes deeper than the OSSE report cards and you can replicate it if you want. |
Anonymous
+1000 |
Anonymous
Based on PPAE - percent proficient above expectations. Seriously, did you actually read any of the available information? |